

Presents


Magnus Mårtensson
Microsoft Regional Director, Azure MVP, CEO Loftysoft
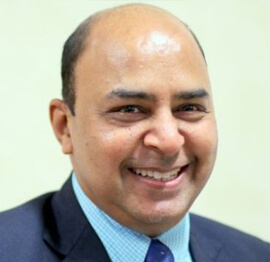
Avirag Jain
Director & CTO R Systems
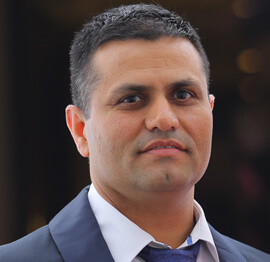
Mahesh Chand
Founder C# Corner, CEO Mindcracker

Chris Gali
CEO & Co-Founder Graphite

Subinder Khurana
Chief Architect StoryProcess, Founder NASSCOM DeepTech Club

Bryan Rishforth
Investor, Chairman Graphite

Bryn Everson
Director Biz Dev Graphite

Raj Tiwari
Digital Transformation Leader, Futurist and Visionary

Joseph Guadagno
Microsoft MVP, Lead Quicken Loans

Nikita Sachdev
Entrepreneur, Blockchain Enthusiast & Advisor, Social Media Influencer

Doug Wagner
COO & Founder Adapt Technical Group

Ritesh Modi
Architect, Senior Evangelist, Cloud Architect

Crystal Wenrick
Director Communications Mindcracker

Allen O’Neill
Microsoft MVP, Consulting Engineer/Architect
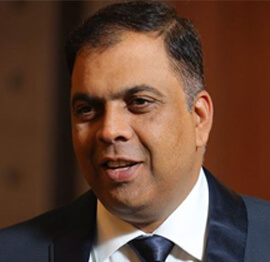
Praveen Kumar
CEO MCN Solutions

Chris Love
Founder Love2Dev, Microsoft MVP, Author

Sanjay Vyas
Microsoft Regional Director, Microsoft MVP, Founder & CEO SkillLabs Technologies

Veena Sarda
Deep Learning Consultant, Author

Sekhar Srinivasan
C# Corner MVP, Microsoft Certified Trainer, Pluralsight Author

Lalit Bansal
Founder & CEO - EIY SYS

Navdeep Garg
CEO Revinfotech

Prakash Tripathi
Tech Manager/Leader, Microsoft MVP, Blogger

Bhavna Jain
Breakthrough Consultant

Naveen Sharma
Enterprise Architect, Leadership Coach, Author
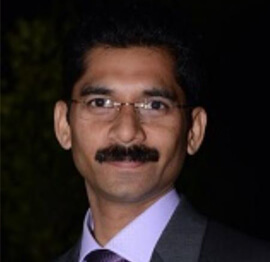
Vidya Vrat Agarwal
Principal Architect, Microsoft MVP, Author

Sheetal Agarwal
Founder Clownselors, Medical Clown, Trainer

Abhishek Kant
Founder GTM Catalyst

Vishnu Saran
Founder & CEO VoiceQube

Sandeep Soni
Founder & CEO Deccansoft, Microsoft Certified Trainer

Parveen Malik
AVP InfoSec & Vulnerability Management, Information Security Expert

Nitin Pandit
Microsoft MVP, Developer Evangelist, Author

Niloshima Srivastava
C# Corner MVP, Tech Architect, Trainer, Blogger

Bala Chirtsabesan
Senior Software Engineer at Microsoft, Author

Manoj Mittal
Sr. Technical Architect, C# Corner MVP, Author

Chandni Di
Co-Founder Voice of Slum

Vithal Wadje
Technical Lead, Microsoft MVP, Author

Shivam Ahuja
Founder SkillCircle, Business Mentor

Chervine Bhiwoo
Solution Architect, Microsoft MVP, Author

Saurabh Jain
Vice President Paytm, Founder Fun2Do Labs, Author

Vinay Solanki
Head IoT at Lenovo, Founder IoT-NCR

Anshu kumari
Founder Blockchainkids, Inventor, Trainer

Amit Singal
CEO Startup Buddy

Dev Pratap
Co-Founder & CEO Voice of Slum

Amey Vartak
Technology Consultant, Full Stack Developer, C# Corner MVP, Author

Viswanatha Swamy
Principal Software Engineer, C# Corner MVP, Author

Sanket Verma
Research Engineer @ Ballistics (Forensics) and Chair, PyData Delhi

Sourabh Somani
Lead Developer, Microsoft MVP, Author

Abhishek Mishra
Software Architect, C# Corner MVP, Author

Siddharth Vaghasia
Technical Consultant, C# Corner MVP, Blogger
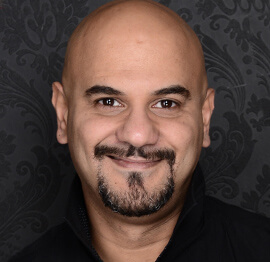
Bassam Alugili
Senior Software Specialist, Database Expert

S Ravi Kumar
Solution Architect, C# Corner MVP, Author

Sundaram Subramanian
Full Stack Developer, C# Corner MVP, Speaker

Deepesh Somani
Solution Architect, Microsoft MVP, Author

Debasis Saha
Technical Project Manager, C# Corner MVP, Blogger, Author

Vipul Jain
Software Architect, C# Corner MVP, Author

Akshay Patel
Technical Architect, Microsoft Certified Trainer, C# Corner MVP, Author

Stephen Simon
RPA Developer, Evangelist, Author

Vivek Sharma
Founder Kingster636, AR/VR Specialist

Jeetendra Gund
Technical Lead, C# Corner MVP, Author

Sujal Beniwal
AI Enthusiast, Student

M Viknaraj
Microsoft MVP, Azure Architect, Author

Prasham Sabadra
Software Architect, C# Corner MVP, Trainer, Author

Aakash Maurya
Senior Developer, C# Corner MVP, Speaker

Ankit Sharma
Senior Software Engineer, C# Corner MVP, Author

Mangesh Gaherwar
Team Lead, C# Corner MVP, Author

Viral Jain
Technical Consultant, C# Corner MVP, Author

Bhasker Das
Solution Architect, Evangelist

Manish Dwivedi
Associate Project Manager

Ck Nitin
Programmer, Author

Rohit Gupta
Technical Trainer, Author

Manish Tewatia
Full-stack Marketer, UX Designer

Bhavya Gaur
Technical Illustrator

Rohit Tomar
SEO/SMO Expert
Web Track
Cloud & Data Track
Dev Track
Registration & Breakfast
Future of Desktop Apps with JS (ElectronJs)
Nitin Pandit
Building Serverless Microservices Using Microsoft Azure
Vithal Wadje
Innovating RPA: A Robot for Every Person
Stephen Simon
Managing Cloud Storage Accounts using Logic Apps
Viknaraj Manogararajah
Data visualization using Python
Sekhar Srinivasan
Going Cross platform with AR Foundation
Vivek Sharma
Keynote
Managing your Azure dependencies in ASP.NET Core apps using VS
Bala Chirtsabesan
Securing Applications on Intelligent Azure
Abhishek Mishra
Getting started with Blazor the Framework of Future
S Ravi Kumar
Lunch
Build Progressive Web Apps using Angular 9
Debasis Saha
Build and deploy to any platform using Azure DevOps
Chervine Bhiwoo
Deep Dive in Azure Service Bus
Akshay Patel
Build a Native Mobile Application using React Native and JavaScript
Joseph Guadagno
Making sense of Web Job, Web Job SDK and Functions in Azure
Prakash Tripathi
CloudFront Distribution in AWS
Viral Jain
Tea Break
Introduction to PowerBI
Aakash Maurya
Build Advanced SPFx solutions with React and Graph API
Siddharth Vaghasia
Build Business Intelligence Analyst (BIA) Skills
Sundaram Subramanian
Deep dive of Power Platform – AI BUILDER
Prasham Sabadra
Panel 1
What's new in SharePoint development
Vipul Jain
Build a SSO (Single Sign On) based Native JavaScript application with Microsoft Identity within 10 minutes
Manoj Mittal
Panel 2
Applications and working of AI
Veena Sarda
Deploying serverless API's with .Net core 3.0 on AWS & Azure
Amey Vartak
Panel 3
Blockchain with .NET Core (Ark)
Anshu Kumari
Closing Note & Prize Distribution
Dev Track
Cloud Track
Architecture Track
Emerging Tech Track
Registration & Breakfast
Creating Full-Stack Web Apps Using Server-Side Blazor
Ankit Sharma
Real time face recognition with MS Cognitive Services
Niloshima Srivastava
Building Scalable APIs with GraphQL
Jeetendra Gund
Future of development with AI and Blockchain
Navdeep Garg
Debugging Tips and Tricks with Visual Studio 2019
Joseph Guadagno
Azure Containers
Abhishek Kant
Enterprise Architecture
Naveen Sharma
Bot Framework - learn it fast and look like a boss!
Allen O’Neill
Keynote
.Net Core & C# 8 Performance
David McCarter
Working with Azure kubernetes services
Ritesh Modi
Becoming an Architect
Vidyavrat Agarwal
Why Techies Need to Learn Product Management
Saurabh Jain
Lunch
Build a rules engine in .Net Core
Sanjay Vyas
Building CI and CD Pipeline using Azure DevOps
Sandeep Soni
Entity Framework Core - Tips and Tricks, Performance Optimization, and Tuning
Bassam Alugili
Hacking your way into Data Science
Sanket Verma
Speed up your .Net Core Website
Sourabh Somani
Azure
Magnus Mårtensson
Demystifying Open Distro for Elasticsearch
Suman Debnath
Future of Data
Shivam Ahuja
Tea Break
gRPC with C# and .Net Core
Mangesh Gaherwar
Panel 1
Essentials of Cloud security
Parveen Malik
Power platform and Dynamics 365
Deepesh Somani
Microservices - the gRPC Way
Viswanatha Swamy
Panel 2
Reserved
Reserved
Closing Note & Prize Distribution
How to profile memory leaks in .NET applications with dotnet-counters
A memory leak in a .NET application is rarely a single dramatic event. It often appears as a gradual rise in private memory, longer garbage-collection pauses, or an application that behaves normally during testing but becomes unstable after several days in production. The .NET garbage collector can reclaim objects that are no longer reachable, but it cannot remove objects that your code still references accidentally.
dotnet-counters provides a lightweight way to investigate this behaviour while an application is running. It exposes runtime counters for allocation, garbage collection, managed heap size, working set, exceptions, and thread-pool activity. The tool does not replace a heap dump or a full memory profiler, but it can quickly show whether a suspected leak is real and where to focus the next diagnostic step.
This approach is useful for ASP.NET Core APIs, worker services, background processing applications, and containerised workloads. It is also practical when a production process must be observed with minimal disruption. A team in Sydney supporting customers in Melbourne, Brisbane, or Perth can collect useful runtime evidence without immediately attaching a heavyweight graphical profiler.
The most valuable result is a timeline rather than a single reading. Memory that rises during a request burst and then falls after collection may be normal. Memory that rises repeatedly while Gen 2 collections fail to reduce the managed heap deserves closer attention.
| Diagnostic signal | What it can indicate | Sensible next step |
|---|---|---|
| Managed heap rises and falls | Normal allocation and collection activity | Compare the pattern over several cycles |
| Working set rises while heap is stable | Native memory, loaded assemblies, buffers, or runtime overhead | Investigate unmanaged allocations and process modules |
| Gen 2 collections increase but heap remains high | Long-lived references or insufficient collection progress | Capture a dump and inspect retention paths |
| Allocation rate is high | Excessive temporary objects or request traffic | Review hot paths, serialisation, and caching |
| Time in GC increases | Allocation pressure or a growing live heap | Check latency, object lifetime, and large objects |
| Heap appears stable but RSS grows in a container | Native allocations, fragmentation, or container behaviour | Compare managed metrics with OS and container metrics |
What dotnet-counters can reveal
dotnet-counters is a command-line global tool included in the .NET diagnostics toolset. It connects to a running .NET process and reads EventCounters or Meter-based runtime metrics. The data is sampled at intervals, making it suitable for watching trends rather than inspecting individual objects.
For a modern .NET application, useful counters commonly include:
gc-heap-size: the managed heap size reported by the runtimeworking-set: physical memory associated with the processallocation-rate: bytes allocated per secondgen-0-gc-count,gen-1-gc-count, andgen-2-gc-count: collection activity by generationtime-in-gc: the proportion of time spent in garbage collectionloh-size: the size of the Large Object Heap where availablethreadpool-thread-count: thread-pool activity that can help correlate load and blocked work
Counter names and availability can vary with the .NET version and runtime provider. Start by listing the available providers and counters rather than assuming every metric exists on every target. In a mixed estate containing .NET 6, .NET 8, and older services, this small check avoids misleading comparisons.
A leak investigation should distinguish managed memory from total process memory. A growing managed heap suggests retained .NET objects. A growing working set with a stable heap points towards native allocations, memory-mapped files, image libraries, sockets, runtime structures, or fragmentation. Both signals matter in a Kubernetes pod or an Azure App Service plan, where the operating system may terminate a process after its total memory crosses a limit.
Installing and connecting to a process
Install the tool on the machine where the target process can be reached:
dotnet tool install --global dotnet-counters
If it is already installed, update it when appropriate:
dotnet tool update --global dotnet-counters
List running .NET processes with:
dotnet-counters ps
Then monitor a process by its process identifier:
dotnet-counters monitor --process-id 12345 \
  --refresh-interval 5 \
  --counters System.Runtime
On Windows PowerShell, the command can be written on one line or continued with PowerShell’s backtick character. On Linux, ensure the diagnostic tool has permission to inspect the target process. Containers may require the tool to run inside the same container, or require suitable process and diagnostic socket access.
For a focused view, specify individual counters when supported by the installed tool and runtime:
dotnet-counters monitor --process-id 12345 \
  --refresh-interval 5 \
  --counters System.Runtime[cpu-usage,working-set,gc-heap-size,allocation-rate,time-in-gc]
The provider syntax is version-sensitive, so use the available provider list if a command returns an unknown counter. In managed hosting environments, process access may be restricted. Azure App Service, for example, may require diagnostics to run through the platform’s supported console or monitoring features rather than through a workstation connected directly to the production worker.
A practical Australian operating pattern is to collect a baseline during a quiet period in AEST or AEDT, then repeat the observation during the busiest customer window. A service used by retailers around the end of the financial year may show a very different allocation profile from the same service on an ordinary Tuesday arvo.
Reading memory trends correctly
Begin with the managed heap and working set. Record several minutes of normal activity, trigger a representative workload, and continue watching after the workload stops. A healthy application usually shows a saw-tooth pattern: allocations push the heap upwards, garbage collection reduces the live portion, and the cycle repeats. The exact shape depends on request volume, object lifetimes, server GC settings, and available memory.
A possible leak has a different pattern. The post-collection baseline keeps moving upwards after comparable workloads. Gen 2 collection counts increase, yet gc-heap-size does not return close to its earlier level. If time-in-gc also rises, the application is spending more time trying to manage a growing live set. This is stronger evidence than a single high memory reading.
Workload consistency matters. Comparing a quiet Melbourne morning with a high-volume Sydney campaign can create a false diagnosis. Repeat the same operation several times, such as importing the same file, processing an equivalent batch, or sending a controlled set of API requests. Note the time, request volume, deployment version, and relevant feature flags.
Look for relationships between counters:
- High allocation rate with a stable heap often means short-lived allocation pressure rather than a leak.
- A rising heap with modest allocation rate may indicate retained objects.
- Stable heap with rising working set suggests memory outside the managed heap.
- Increasing Gen 2 collections and large-object usage can point to long-lived buffers, oversized responses, or cache entries.
- A rising exception count may identify a failed processing loop that repeatedly allocates error objects and retains work items.
The tool reports symptoms, not retention paths. It can show that memory is not being reclaimed, but it cannot tell you which dictionary, event handler, static field, or task is keeping an object alive.
Turning counter evidence into a diagnosis
Once the trend is repeatable, capture a richer diagnostic artefact. A dump can be collected with dotnet-dump, while event traces can be gathered with dotnet-trace. A memory profiler can then show object types, generation placement, reference paths, and retained sizes.
Common causes include unbounded in-memory caches, static collections, event subscriptions that outlive their publishers, timers that retain state, queued work that is never completed, and closures holding large object graphs. Incorrect use of dependency-injection lifetimes can produce similar symptoms. A singleton that stores request-specific data effectively extends that data’s lifetime for the duration of the process.
Large Object Heap behaviour deserves special attention. Large arrays, strings, JSON documents, image buffers, and file contents can remain alive long enough to create pressure even when the application eventually frees them. Repeated large allocations can also produce fragmentation. A counter trend may reveal the problem, while a dump confirms which object types occupy the space.
Use a controlled comparison after applying a fix. Deploy the change to a staging slot or a canary instance, run the same workload, and compare the post-collection baseline. In a regulated Australian business, retaining diagnostic dumps may involve customer data and privacy obligations, so remove sensitive content where possible and store files according to the organisation’s access and data-retention rules.
Operating the investigation in production
Keep observation lightweight and time-bounded. dotnet-counters is generally less intrusive than a full trace or profiler, but continuous monitoring still creates operational overhead and diagnostic data. Set a refresh interval that reveals the trend without producing unnecessary output, and save readings with timestamps alongside deployment and infrastructure events.
For Linux services, systemd and container logs can be correlated with counter output. In Kubernetes, compare the managed heap with pod RSS, memory limits, restart counts, and throttling. A pod in an Azure Australia East region may appear healthy at the application level while approaching its container limit because native memory is growing outside the GC heap.
Use process identifiers carefully after restarts: a new deployment receives a new PID. A small script can discover the current process, start monitoring, and write output to a dated file. If the service runs across multiple instances, monitor more than one replica because a leak may depend on a particular traffic route, tenant, feature flag, or node condition.
Production access should follow least privilege. Avoid exposing diagnostics endpoints publicly, and do not copy dumps casually between offices or cloud regions. Teams operating across Sydney, Canberra, and Perth may have different access paths and support rosters, so document who can collect evidence, where it is stored, and when it must be deleted.
dotnet-counters is most effective as an early-warning and triage tool. It establishes whether memory growth is repeatable, separates managed from process-level symptoms, and helps select the right next diagnostic method. Combined with a controlled workload, a heap dump, and disciplined operational records, it turns a vague report that an application is “chewing through memory” into evidence that developers can investigate and verify.











1, CBD, Maharaj Surajmal Road, Near Yamuna Sports Complex, Delhi, 110032





GENERAL QUERIES
Manish Tewatia
manish@csharpcon.com
+91-9718-431-042
TICKET QUERIES
Atul Gupta
conference@csharpcon.com
+91-9910-125-804